Test:
Statistics Foundation II - Ambitious
×
Double click on maths expressions to zoom
Question 1:
Find the mean value in the following data set:
17
,
25
,
2
,
21
,
29
,
8
,
36
,
5
,
11
,
19
A
18
.
9
B
20
.
4
C
22
.
7
D
17
.
3
Question 2:
Find the range in the following data set:
115
,
36
,
118
,
−
12
,
33
,
−
10
,
98
,
106
,
124
,
119
A
112
B
124
C
134
D
136
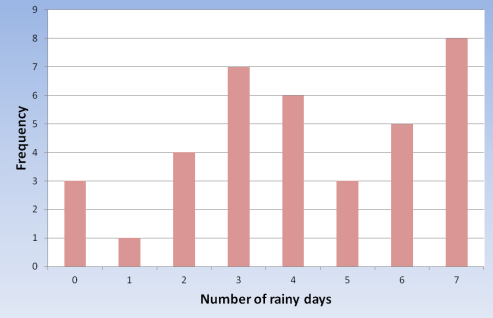
Question 3:
Bar chart below represents number of rainy days over a month in a group of towns:
How many towns are compared?
A
37
B
43
C
25
D
41
Question 4:
Using the bar chart from question 3, find the modal number of rainy days
A
5
B
6
C
4
D
7
Question 5:
Mean score of a basketball team in
12
games is
93
points. What is the total number of points scored?
A
954
B
1116
C
1206
D
1012
Question 6:
Continuing the question 5, the mean score of
16
games is
85
points. What is the mean score of the last
4
games?
A
78
B
53
C
81
D
61
Question 7:
The table below shows the scores of
90
basketball games. Which of the graphs below represents the table?
Score
Frequency
50
<
x
≤
60
7
60
<
x
≤
70
12
70
<
x
≤
80
23
80
<
x
≤
90
25
90
<
x
≤
100
15
100
<
x
≤
110
8
A
B
C
D
Question 8:
Using the table from the question 7, calculate the mean score of the basketball game
A
90.66
B
75.75
C
80.88
D
83.23
Question 9:
Which of the stem-and-leaf diagrams represents the following data:
11
,
5
,
21
,
23
,
31
,
41
,
7
,
18
,
15
,
27
,
24
,
29
,
32
,
35
,
36
,
23
A
0
5, 7
1
1, 5, 8
2
1, 3, 4, 7, 9
3
1, 2, 5, 6
Key: 0|5 represents 5
B
0
5,7
1
1,5,8
2
1,3,4,7,9
3
2,5,6
Key: 0|5 represents 5
C
1
5, 7
2
1, 5, 8
3
1, 3, 4, 7, 9
4
2, 5, 6
Key: 1|5 represents 5
D
1
1,5,8
2
1,3,4,7,9
3
1,2,5,6
Key: 1|1 represents 11
Question 10:
Using the stem-and-leaf diagram below find the median:
0
1,5,8
1
1,1,2,6
2
3,3,3,7,8,9,9
3
2,4,5,5,5,5
4
0,2,3,4,7,7,8,8
A
30
B
30.5
C
32
D
29
Prev Page
Next Page
Submit
Click here to resume the test
Saving test
 Saving test