Test:
Pie Charts - Ambitious
×
Double click on maths expressions to zoom
Question 1:
The table below represents
360
books grouped by their category:
Book category
Frequency
Science-fiction
150
Romance
125
Adventure
50
Horror
35
Draw a pie chart representing this table
A
B
C
D
Question 2:
The table below represents student grades in mathematics exam:
Book category
Frequency
A
15
B
22
C
15
D
8
Draw a pie chart representing this table
A
B
C
D
Question 3:
The table below shows the favourite game among a group of
50
pupils:
Book category
Frequency
Football
35
Rugby
10
Basketball
3
Volleyball
2
What is the angle of the sector representing Rugby?
A
50
°
B
36
°
C
72
°
D
10
°
Question 4:
The pie chart represents a monthly expenditure of a household that totals
£
800
:
What is the expenditure for utilities?
A
£
220
B
£
150
C
£
160
D
£
200
Question 5:
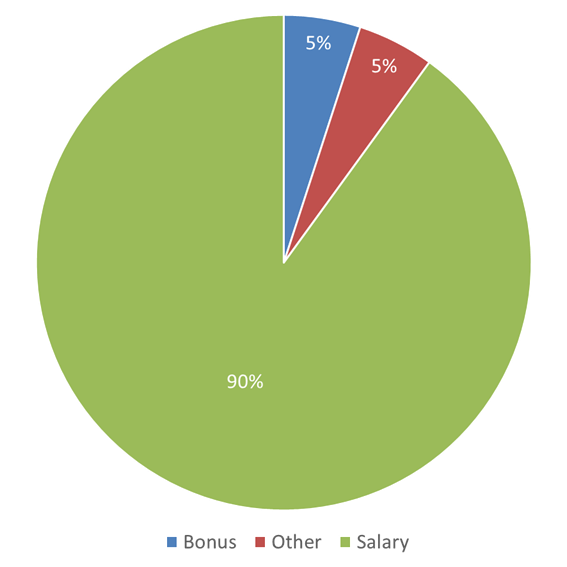
The pie chart represents a monthly income of a household that totals
£
2600
:
What is the angle for the salary pie slice?
A
338
°
B
324
°
C
350
°
D
95
°
Question 6:
The pie chart represents a number of employees in a company grouped by departments:
What is the sum of emplyees percentage working in the QA and DEV departments?
A
56.41
%
B
57.12
%
C
55.55
%
D
49.76
%
Question 7:
Household income for March is represented by the pie chart below and totals
£
3000
:
In April there was an additional
£
200
bonus received to the household income. What is the percentage of the bonus in April?
A
9.25
%
B
12.31
%
C
13.05
%
D
10.94
%
Question 8:
The pie chart below represents a car fleet in a company grouped by the car brand:
There are
18
BMW company cars. How many VW cars are in the fleet?
A
7
B
5
C
12
D
4
Question 9:
The table shows game consoles popularity amongst students:
Book category
Frequency
WII
35%
XBox
40%
PlayStation
25%
Draw a pie chart representing the above data
A
B
C
D
Question 10:
The pie chart represents results of a survey conducted on a group of students in order to find out their favourite movie genre:
What is the angle for the comedy sector?
A
80
°
B
78
°
C
66
°
D
72
°
Prev Page
Next Page
Submit
Click here to resume the test
Saving test
 Saving test